LOCAL WATCHES/WARNINGS/ADVISORIES
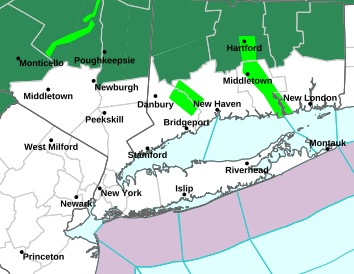
NORTHEAST WATCH/WARNINGS/ADVISORIES

| |
| |
CURRENT WATCH/WARNING/ADVISORY MAP
|
LOCAL WATCHES/WARNINGS/ADVISORIES
|
NORTHEAST WATCH/WARNINGS/ADVISORIES
|
 |
 |
 |
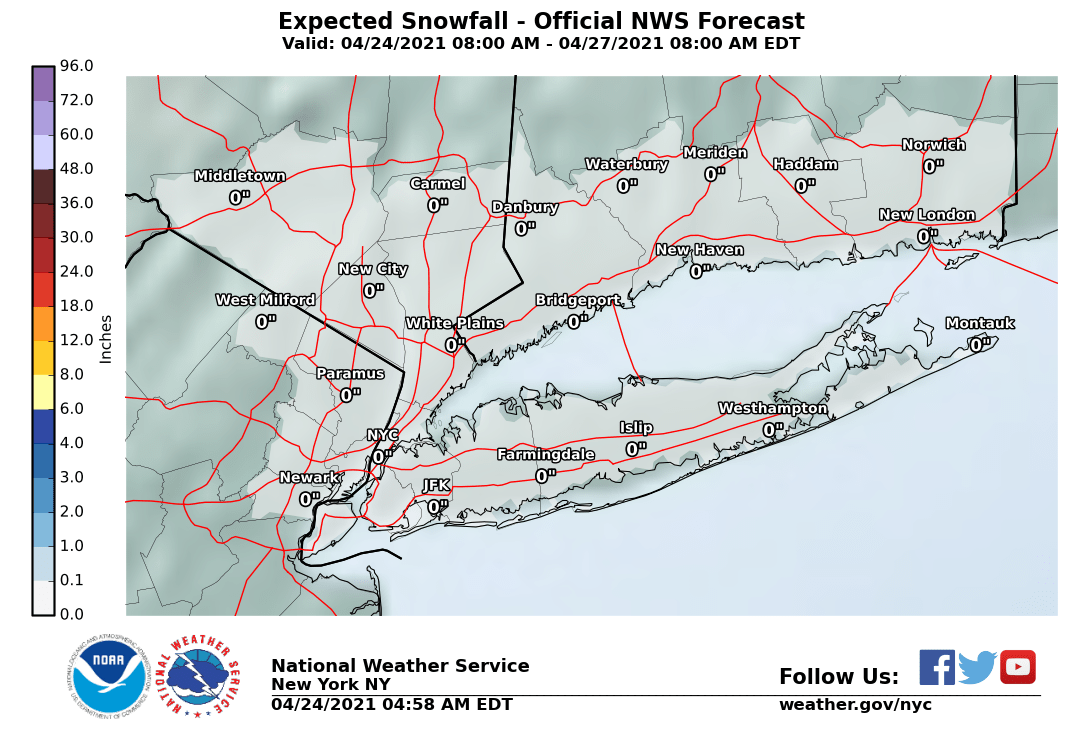
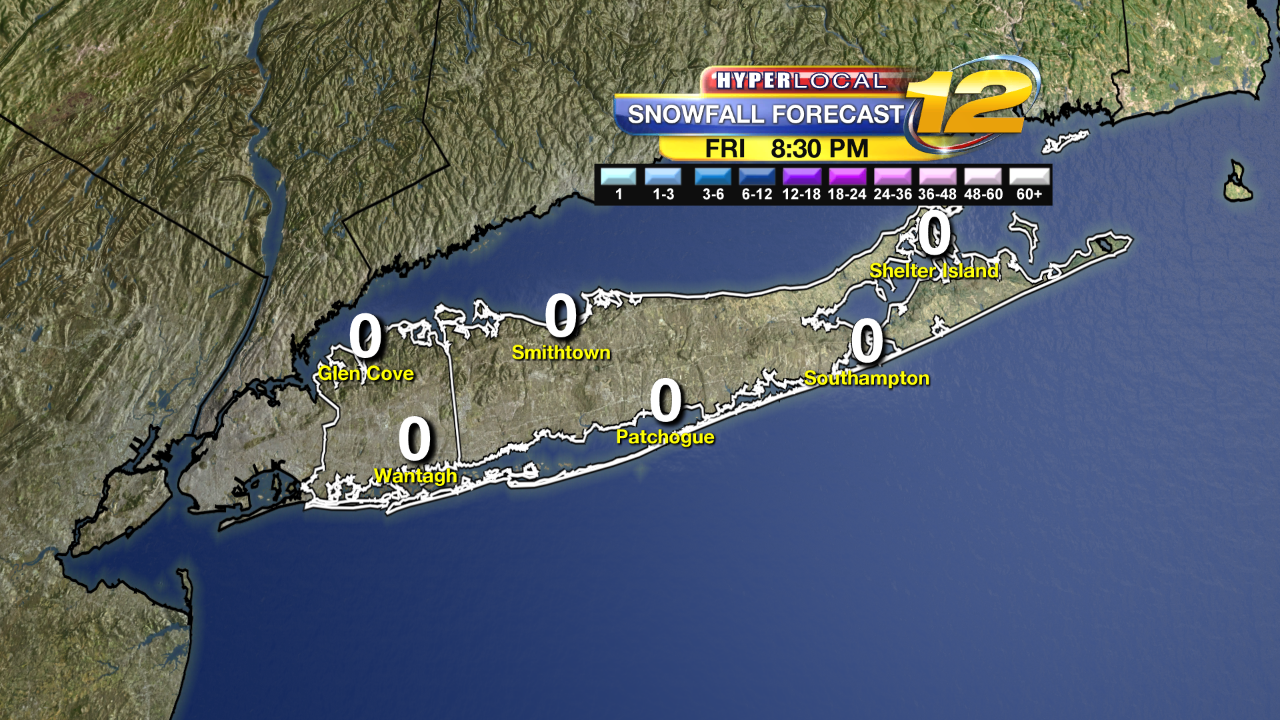
Snowfall Forecast |
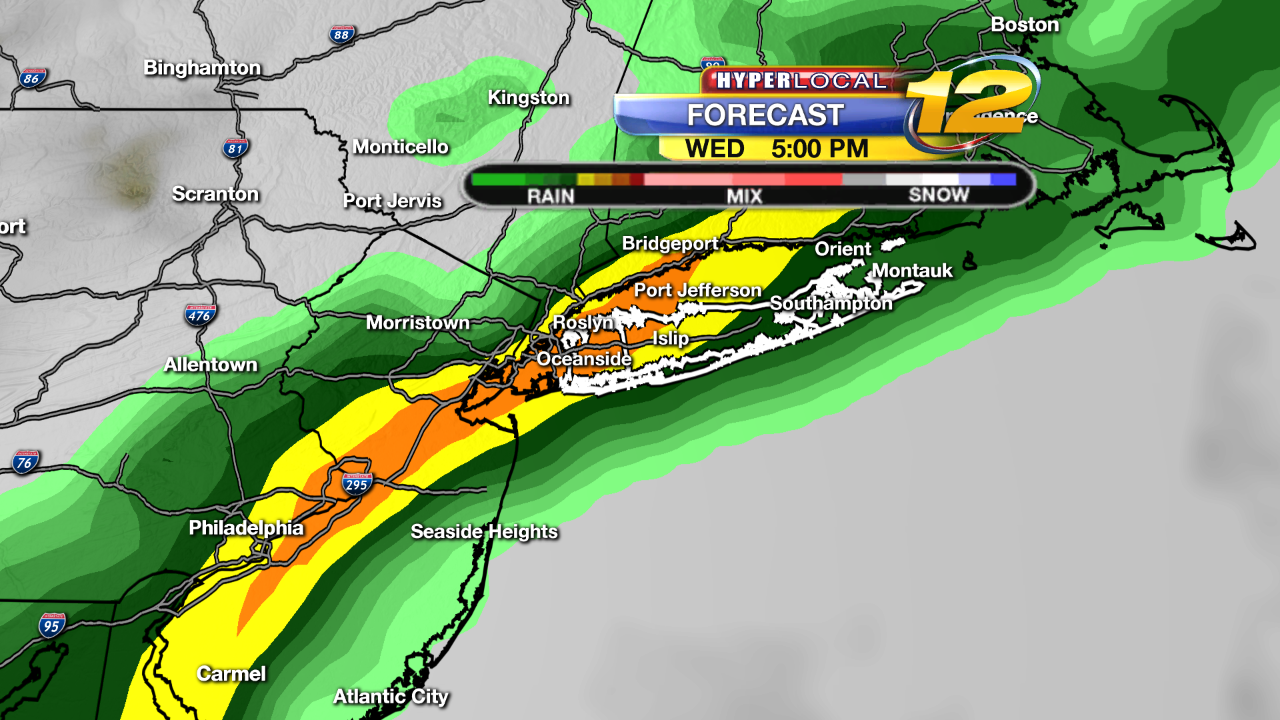
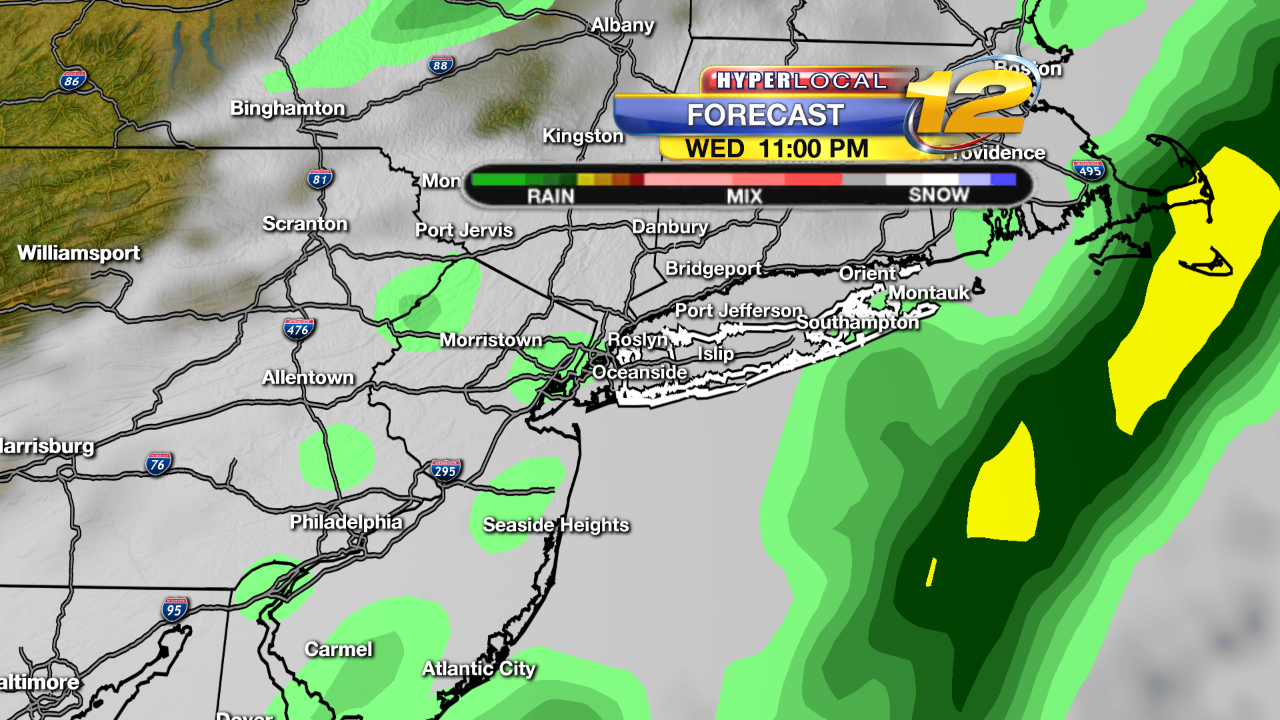
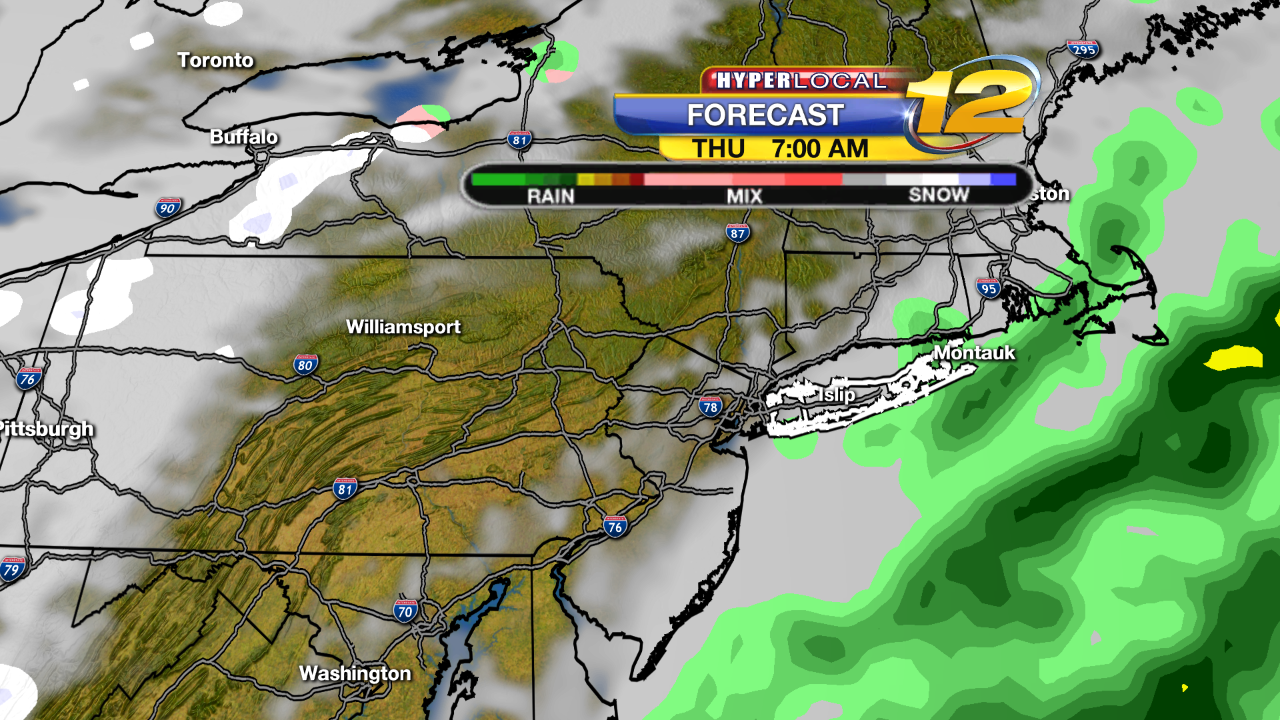
Precipitation Forecast |
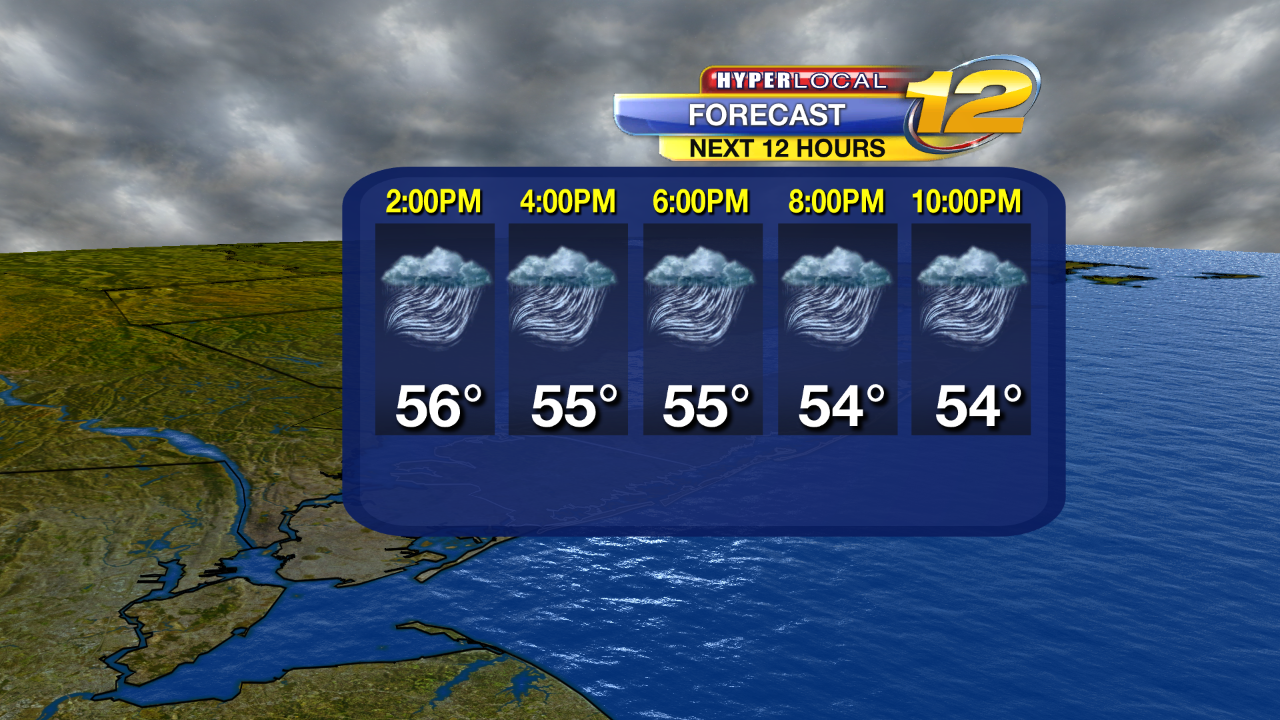
12 Hour Forecast |
 |
 |
 |
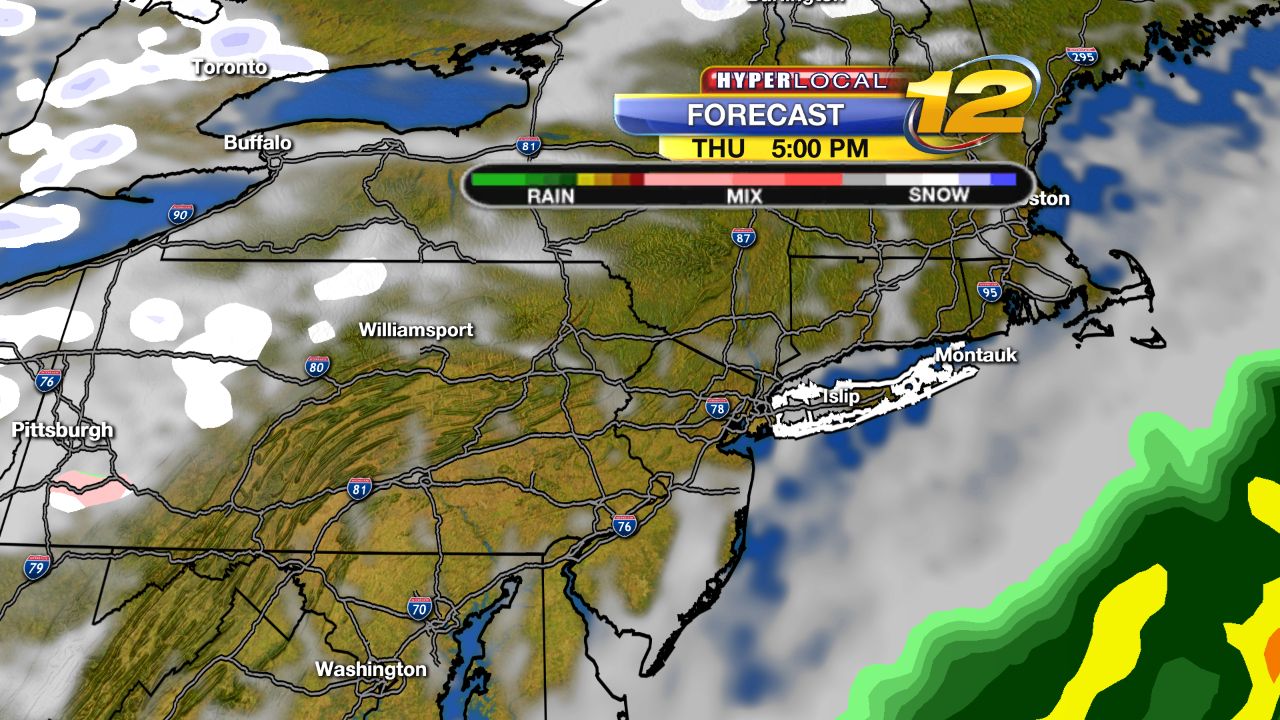
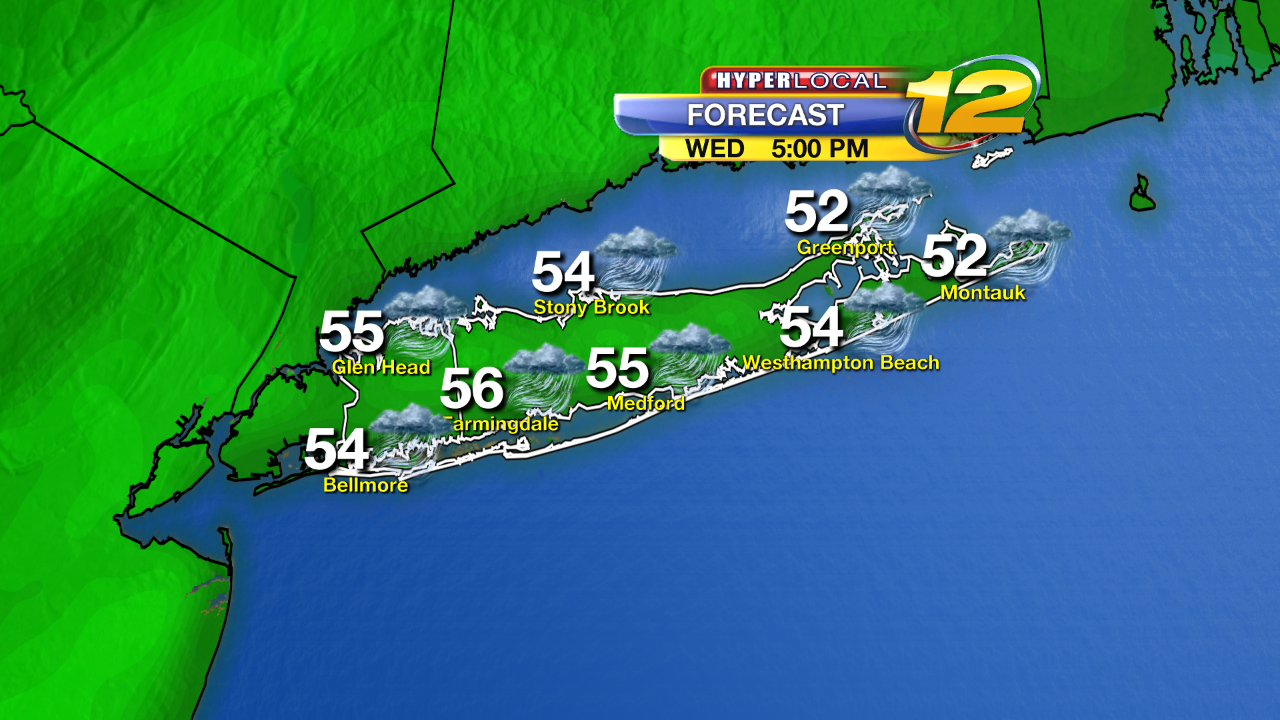
Forecast |
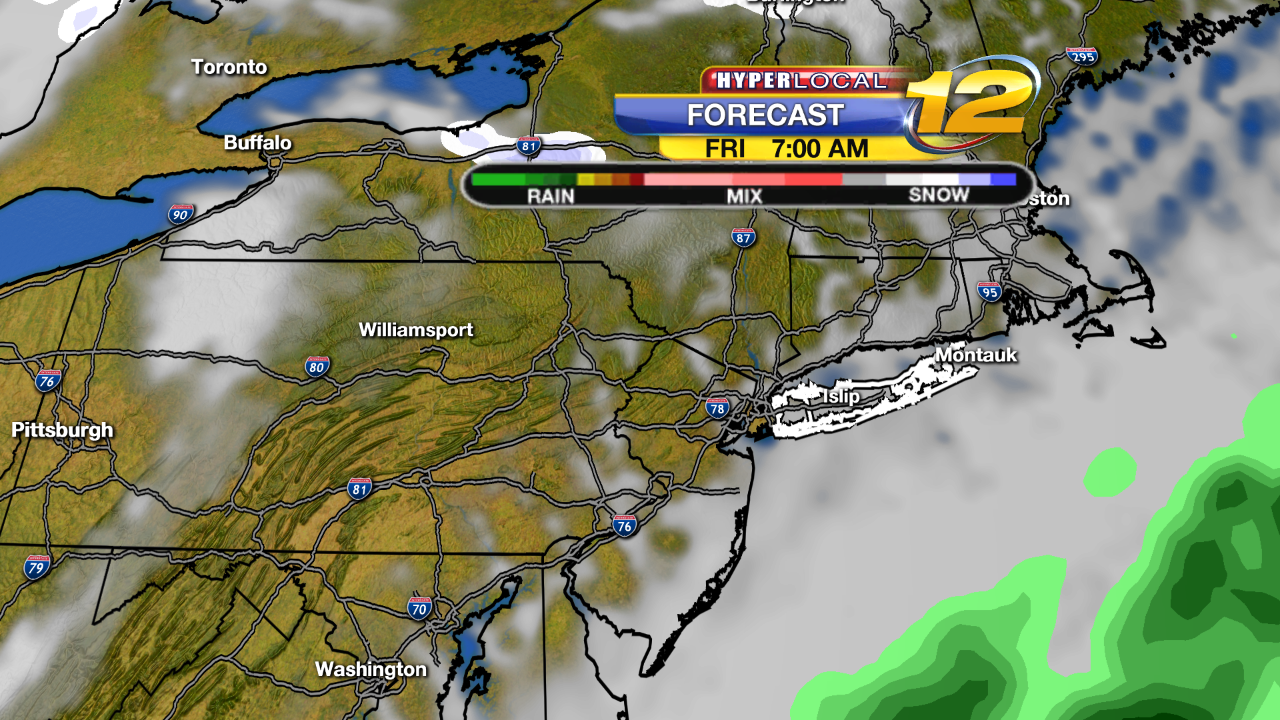
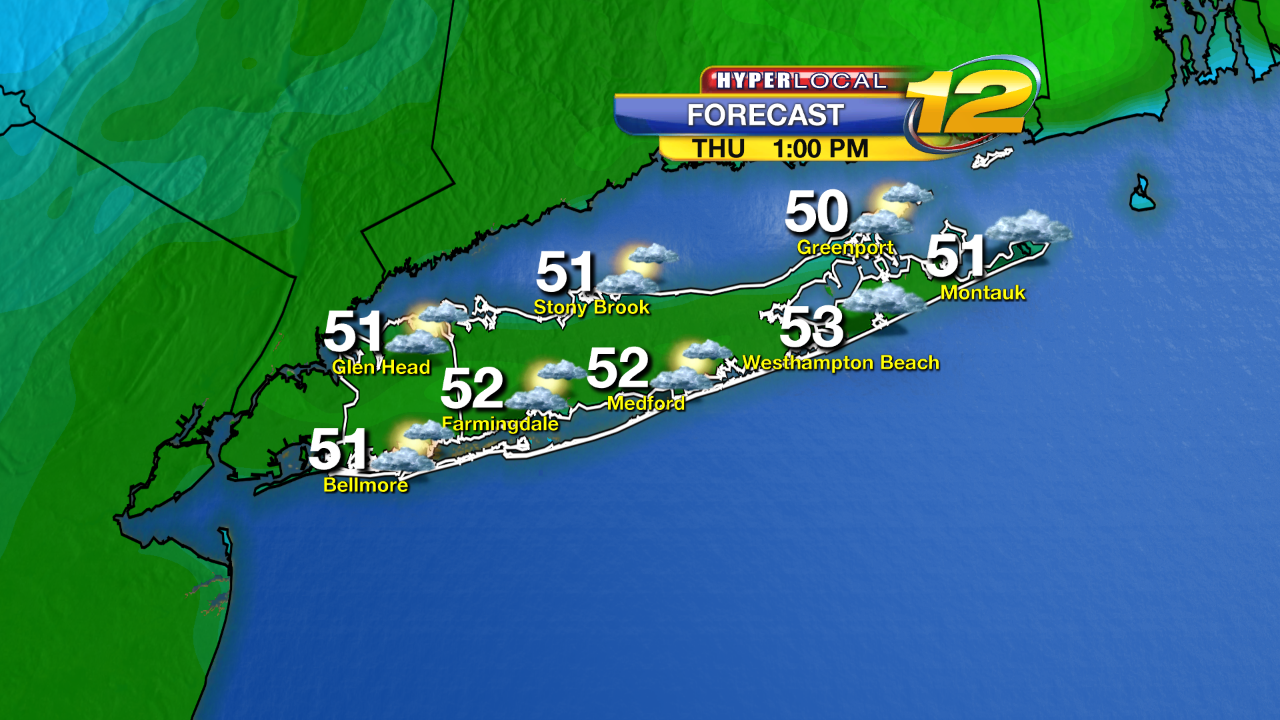
Forecast |
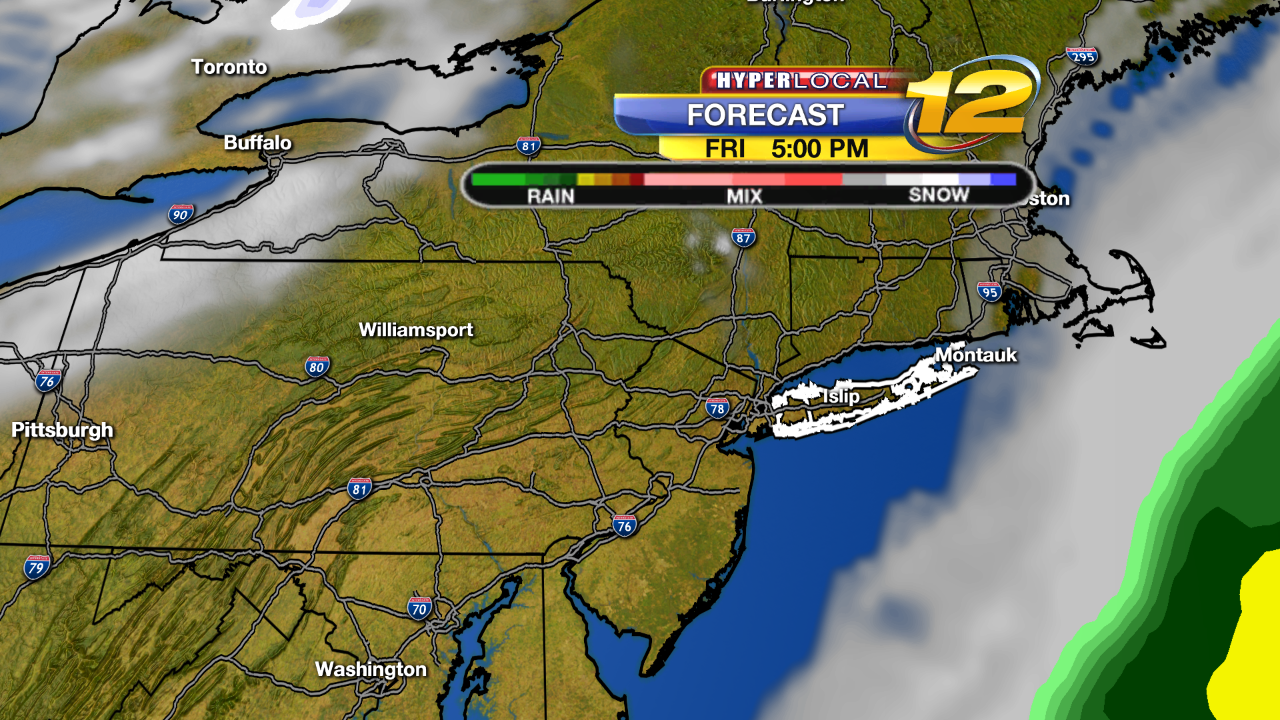
Forecast |
 |
 |
 |
3-6 hour Forecast |
6-12 hour Forecast |
12-18 hour Forecast |
 |
 |
 |
18-24 Forecast |
24-36 Forecast |
36-48 hour Forecast |
 |
 |
 |
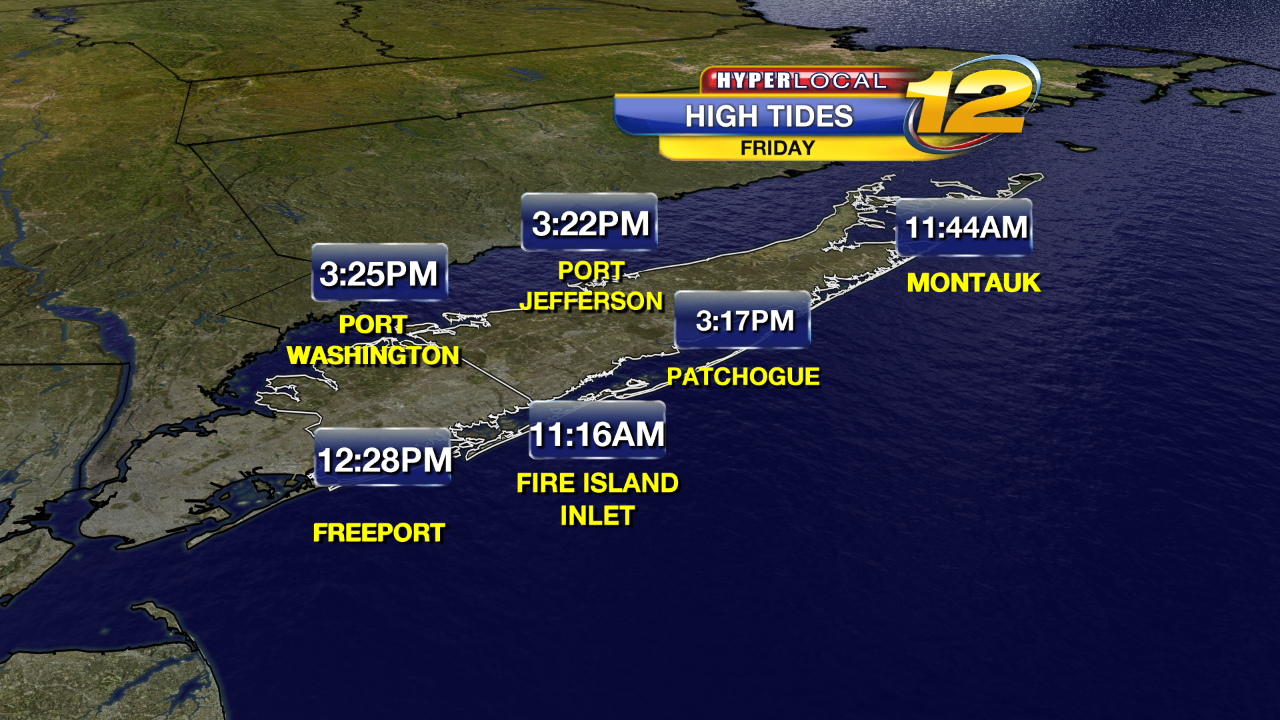
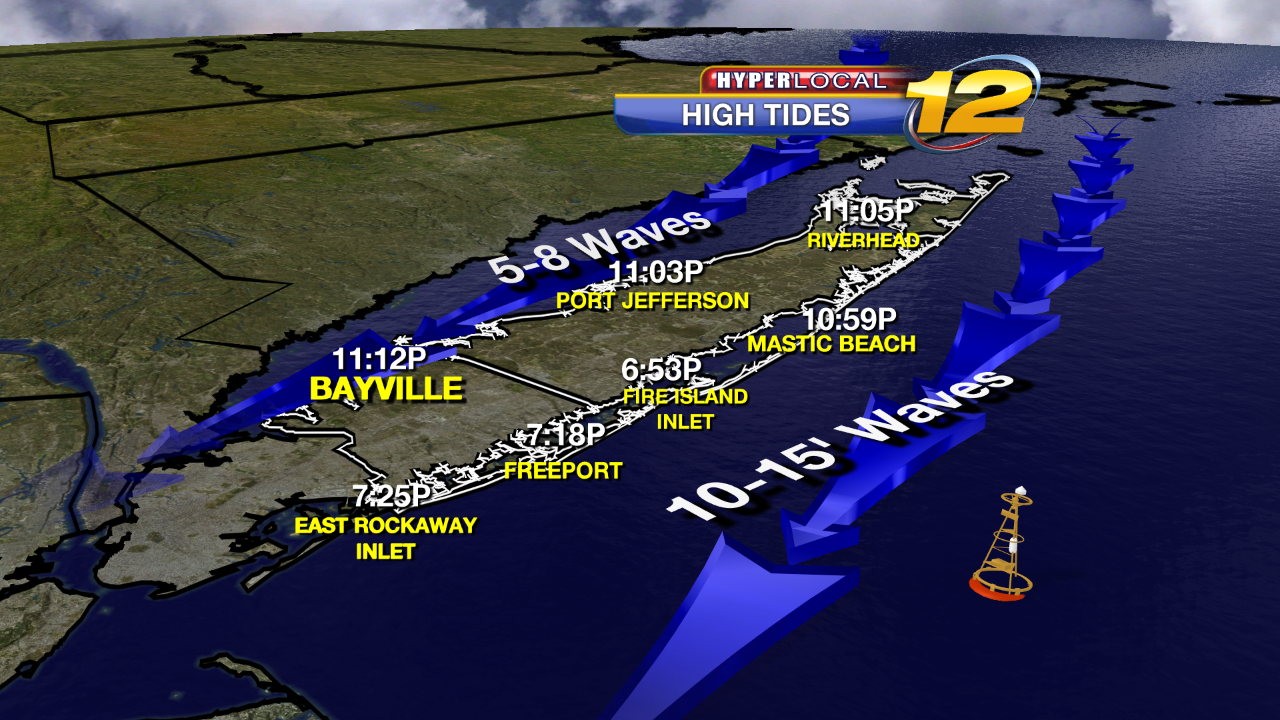
Tides Forecast |
Tides Forecast |
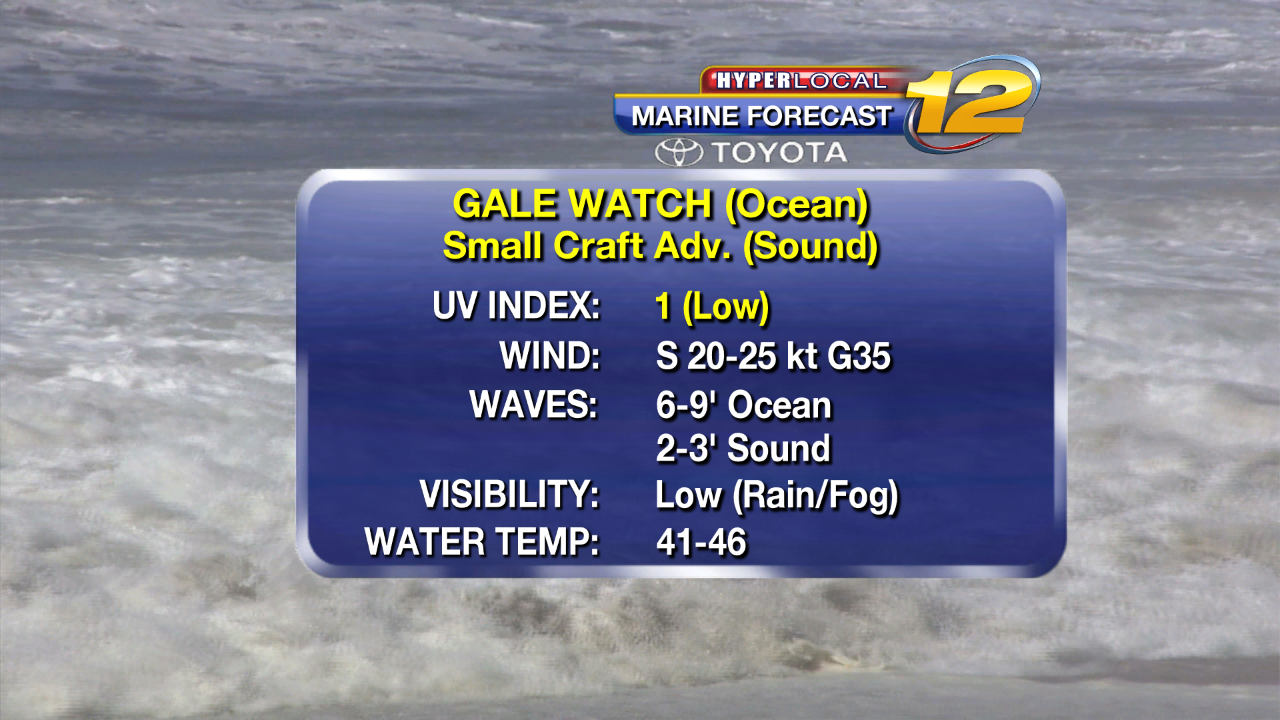
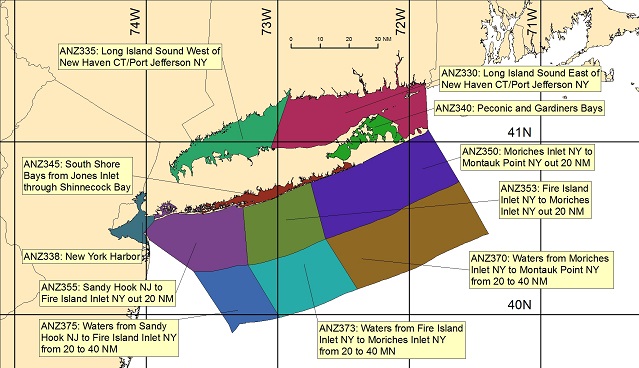
Marine Forecast |
 |
 |
 |
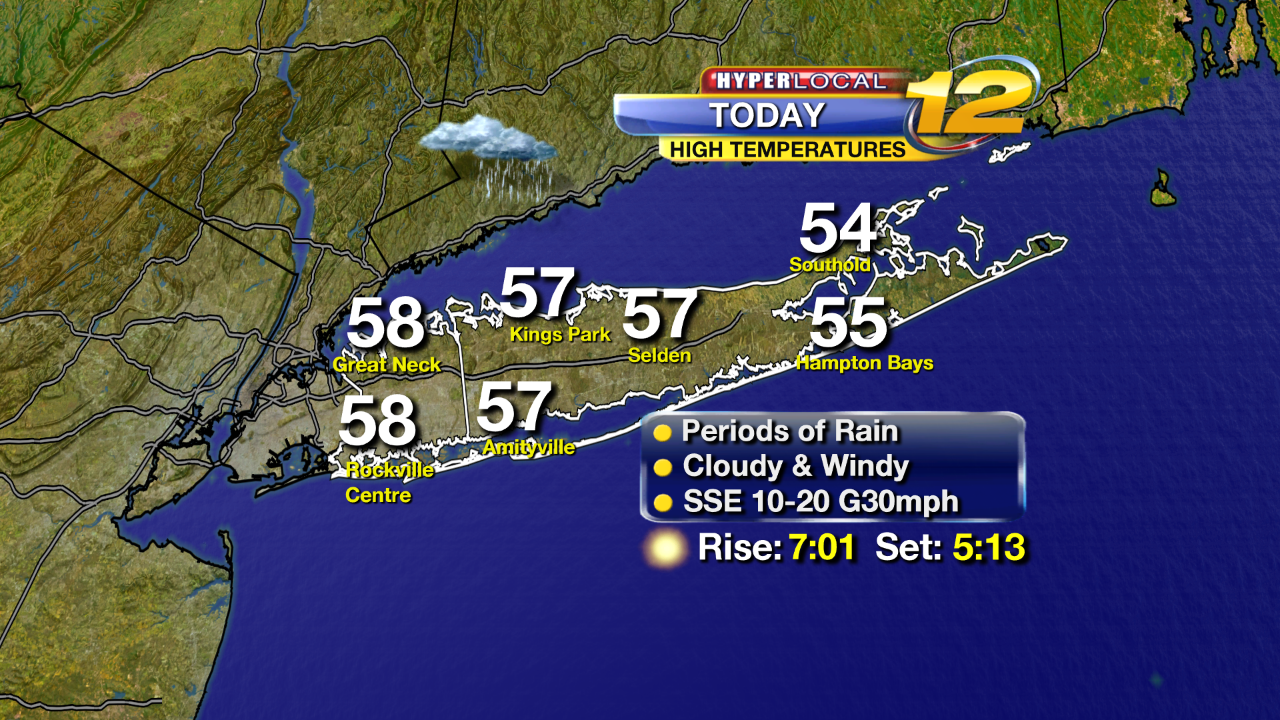
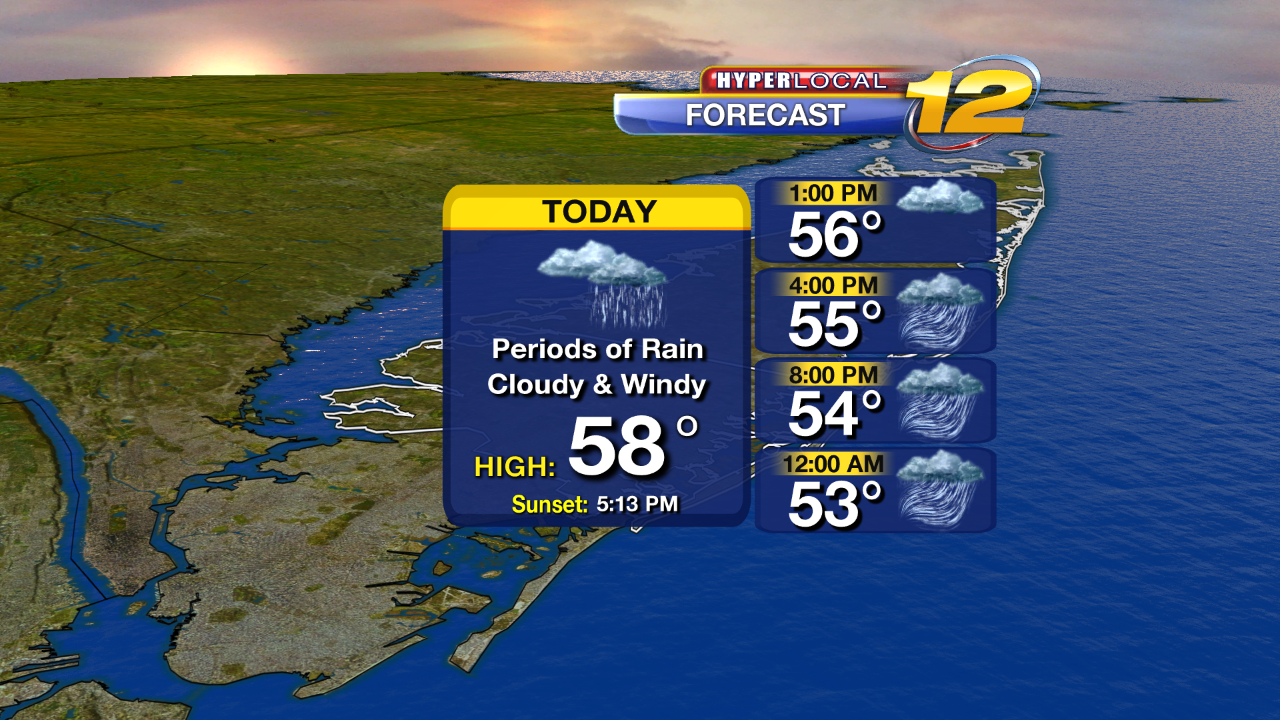
Today Forecast |
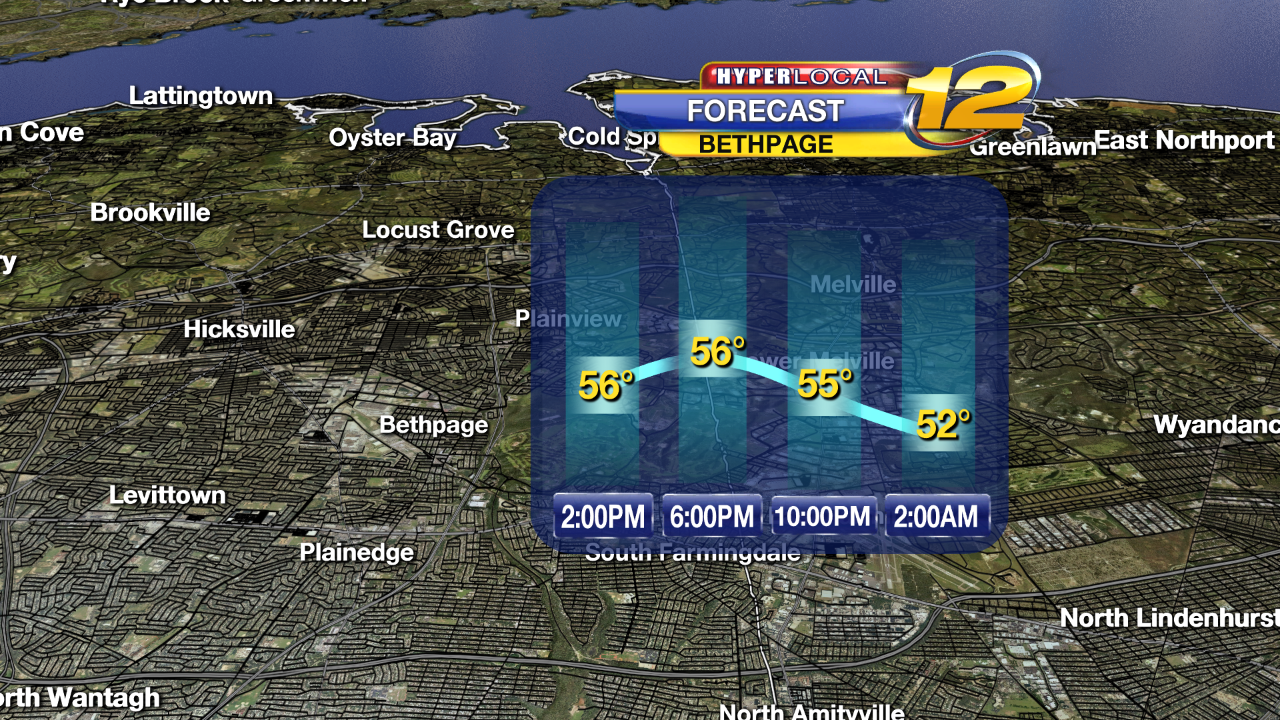
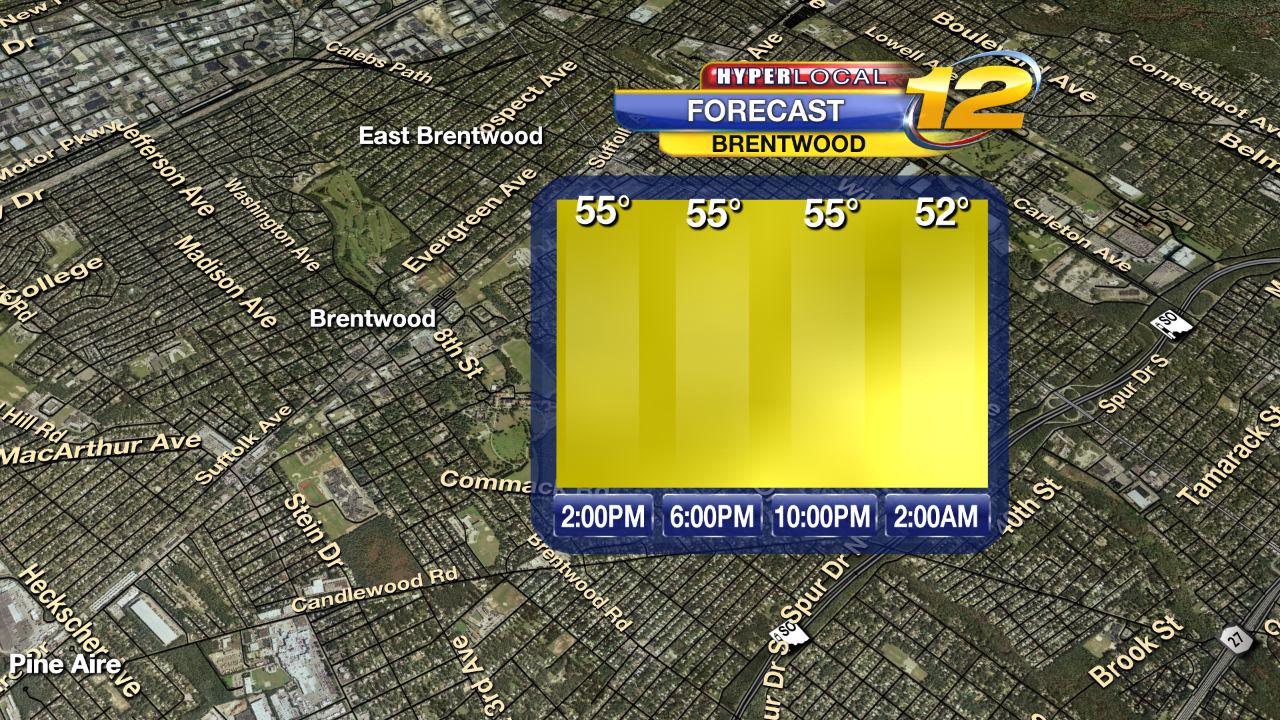
Local Forecast |
Local hour Forecast |
 |
 |
 |
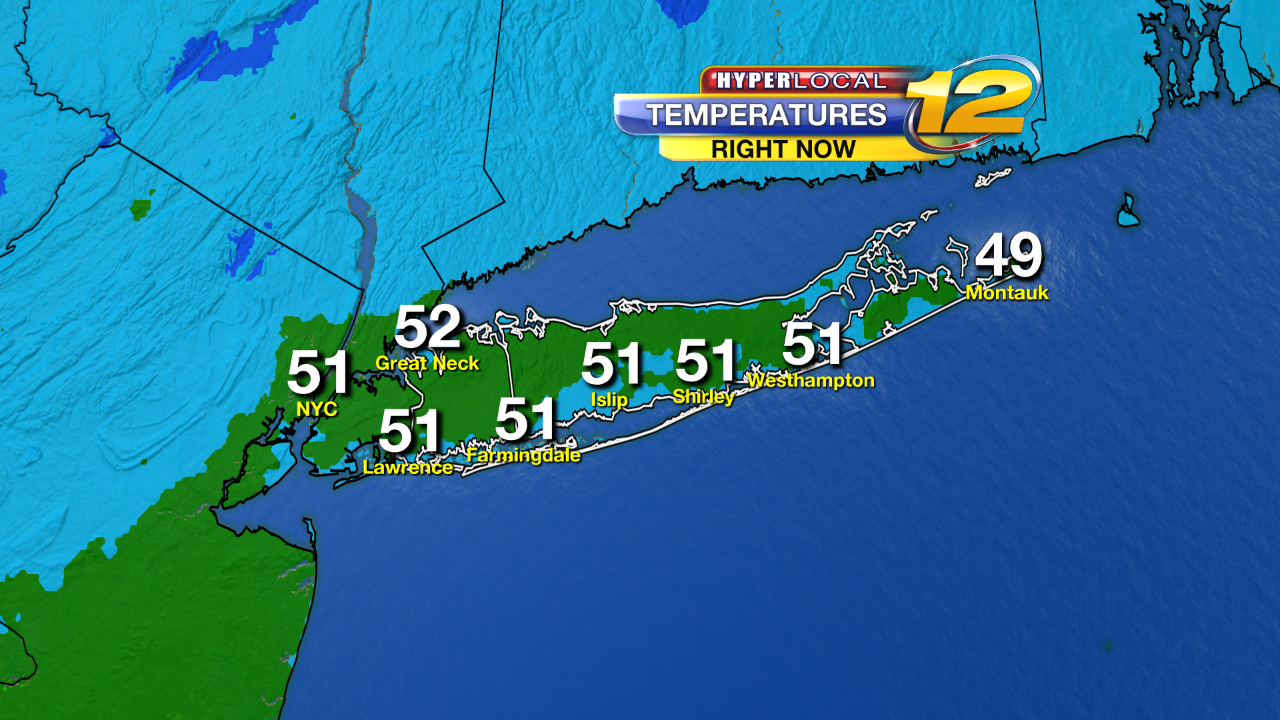
Current Temperatures |
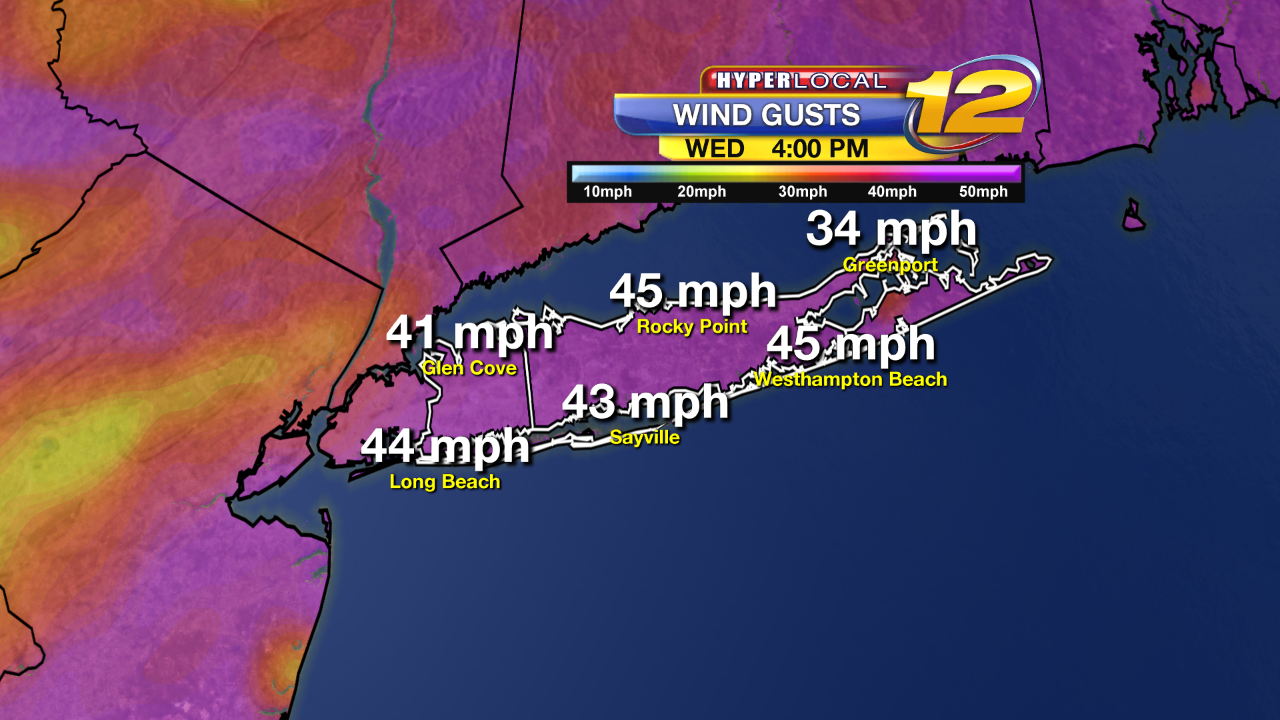
24 Wind Forecast |
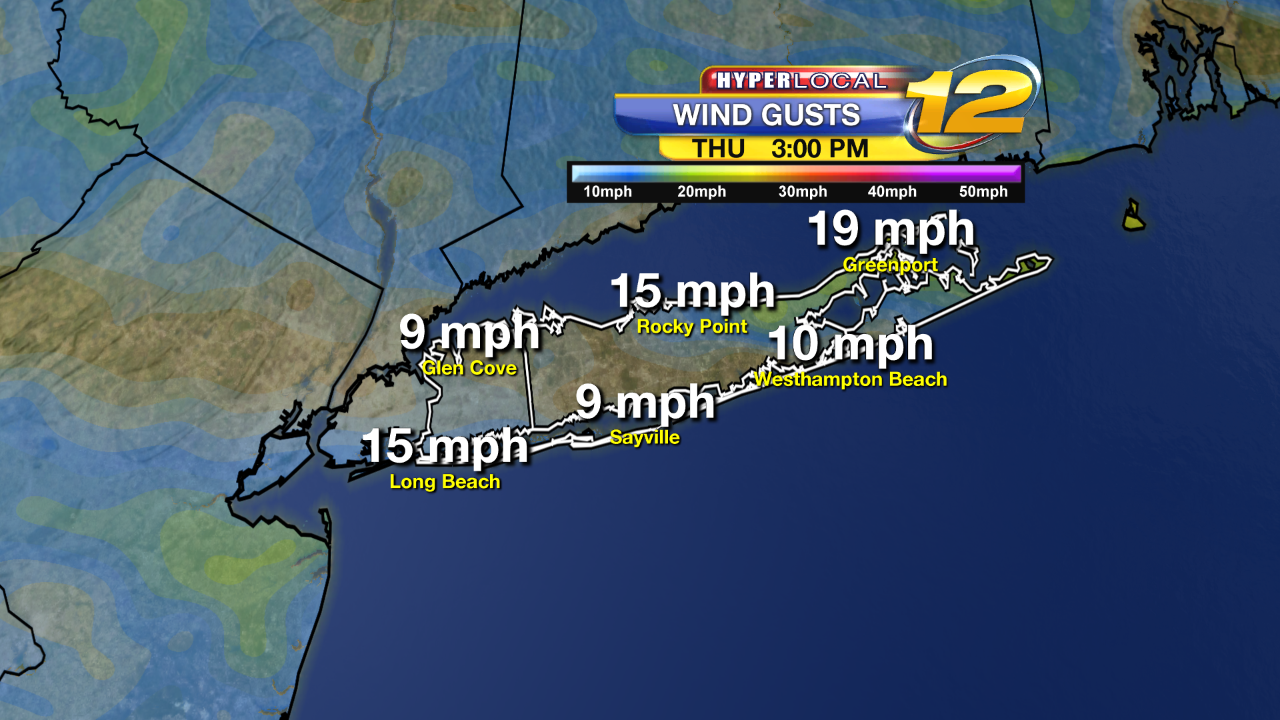
36 hr wind Forecast |
 |
 |
 |
Snow Forecast |
24 hr Local Forecast |
36 hr local Forecast |
WINTER RADAR
 |
 |
 |
DOPPLER RADAR |
NORTHEAST WINTER RADAR
|
NATIONAL WINTER RADAR |
| "This map is provided by ZoomRadar.com" |
|
LOCAL RADAR
|
OKX NATIONAL
WEATHER SERVICE PECIPITATION/SNOW/ICE FORECAST
|
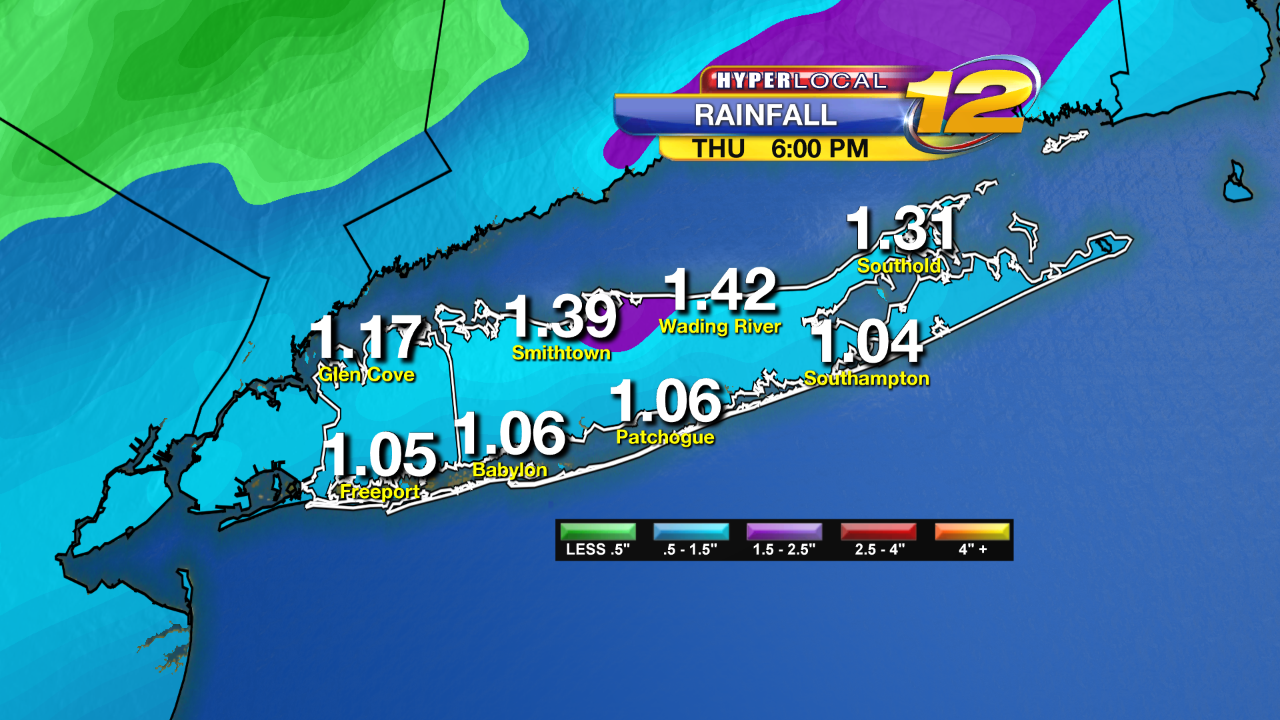
Liquid Equivalent (Rain + melted Snow + melted Ice) |
Ice Forecast
|
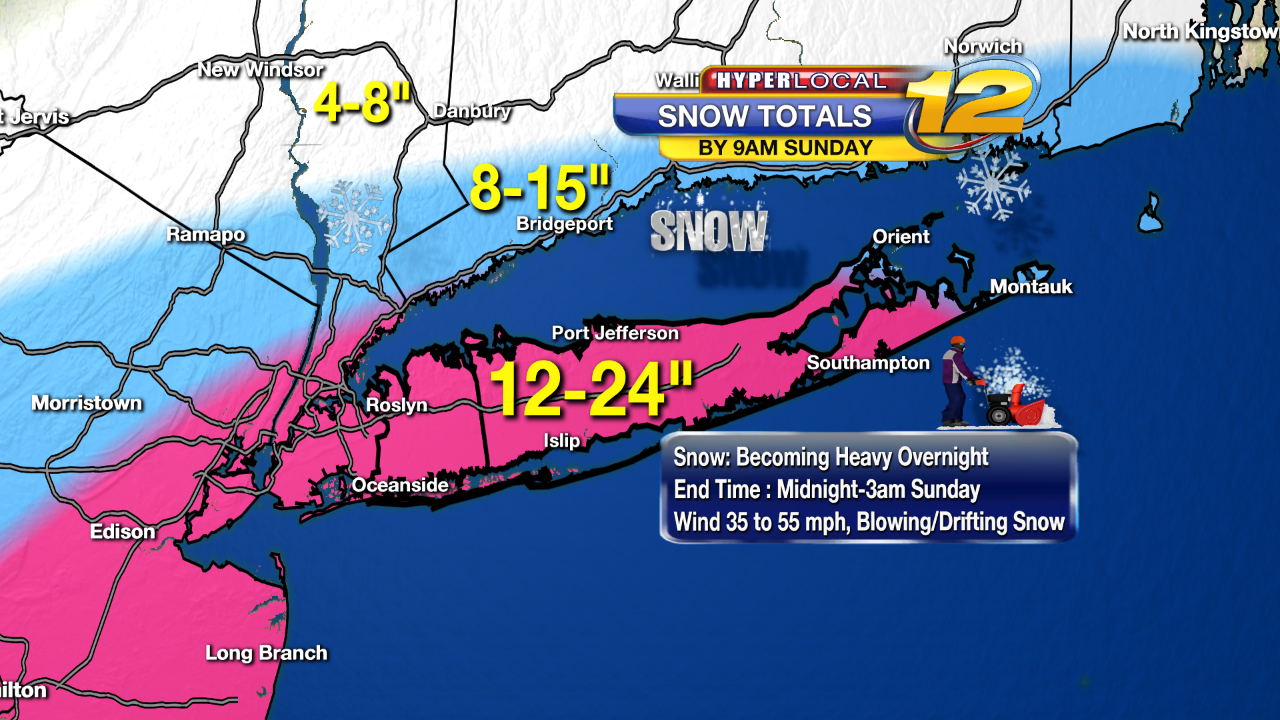
6 HR SNOWFALL
FORECASTS THRU 36 HRS
Nassau
County Locations Snowfall Table , Suffolk
County Locations Snowfall Table
 |
 |
 |
0-6 hr Snowfall Forecast |
06-12 hr Snowfall Forecast |
12-18 hr Snowfall Forecast |
 |
 |
 |
18-24 hr Snowfall Forecast |
24-30 hr Snowfall Forecast |
30-36 hr Snowfall Forecast |
WEATHER MAPS
THRU NEXT 48 HRS - IS THERE A STORM COMING?
|
|
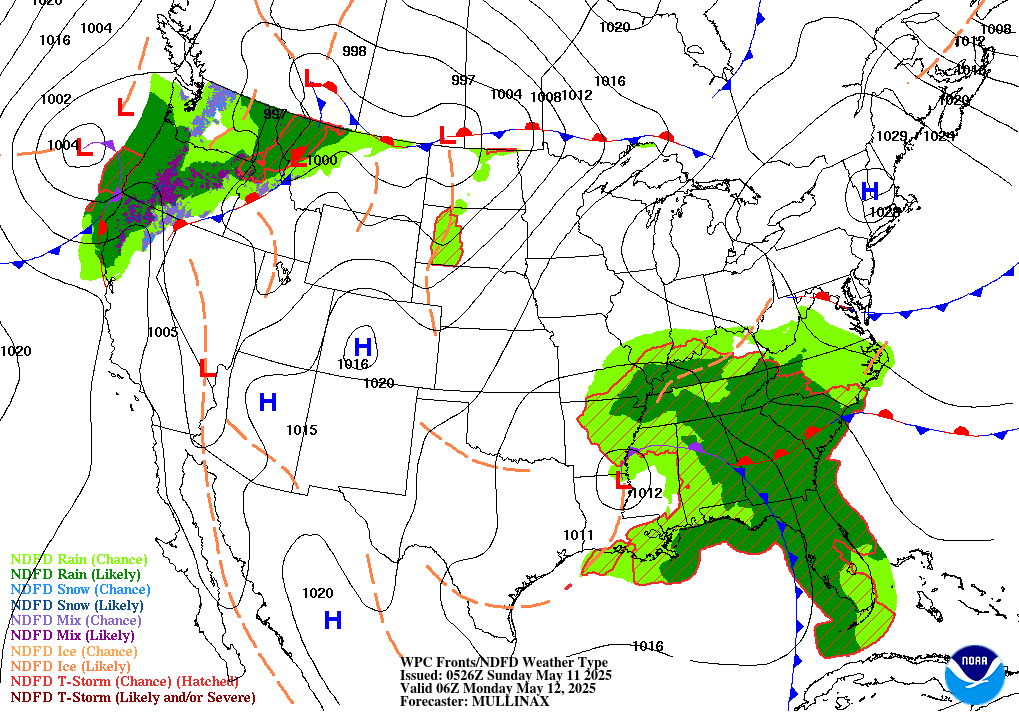 |
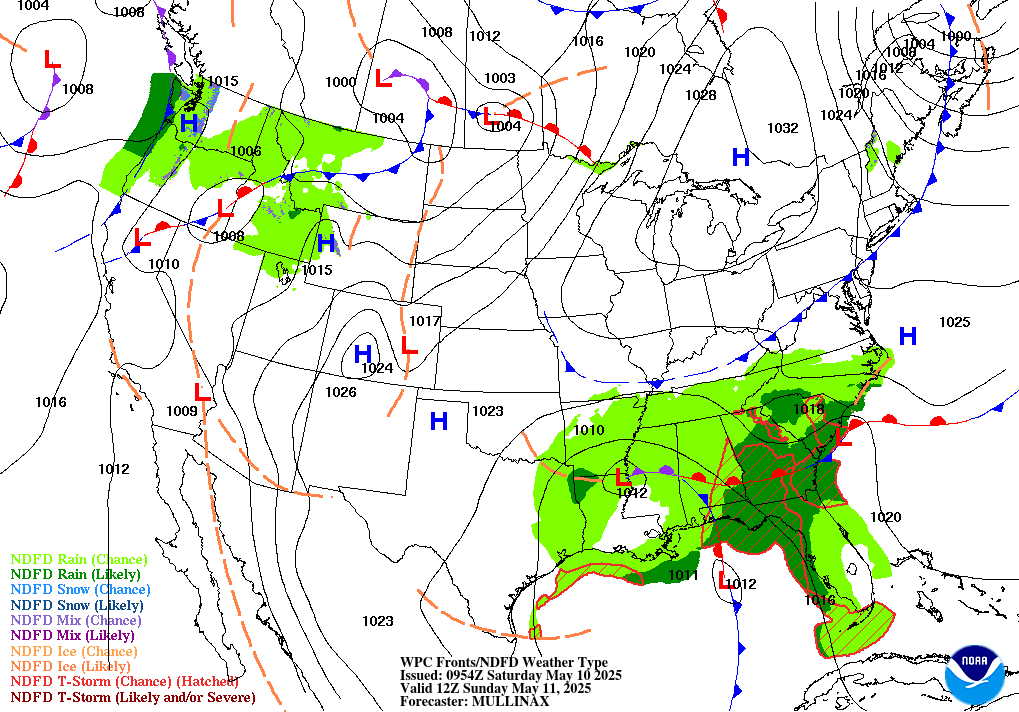
| 0-6 hr Forecast WX Map | 06-12 hr Forecast WX Map | 12-18 hr Forecast WX Map |
|
|
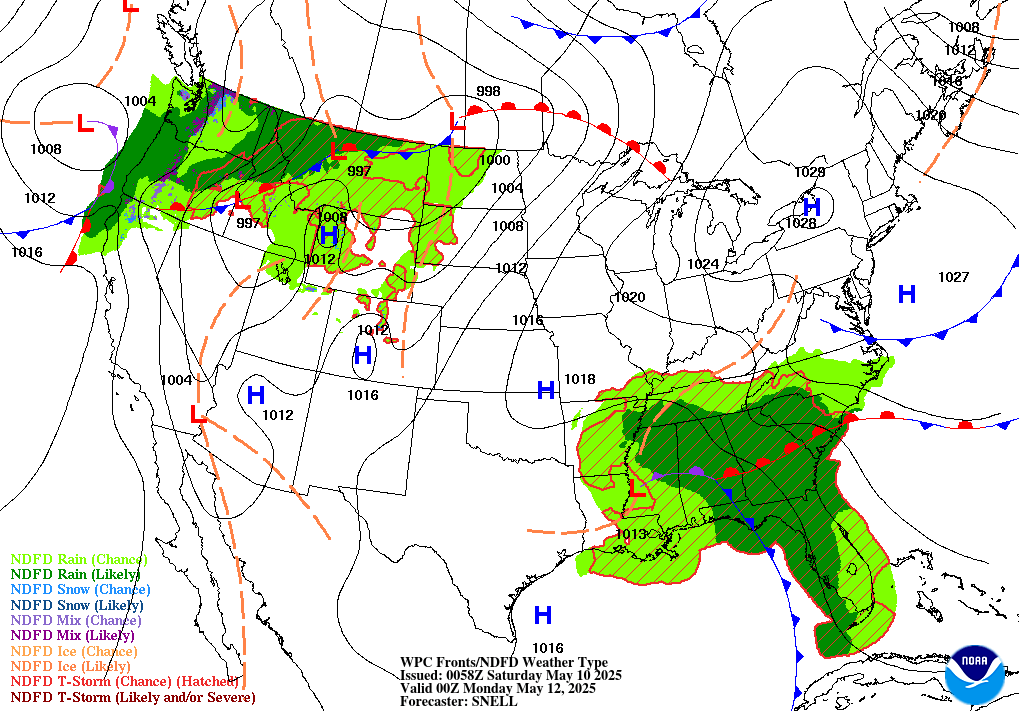 |
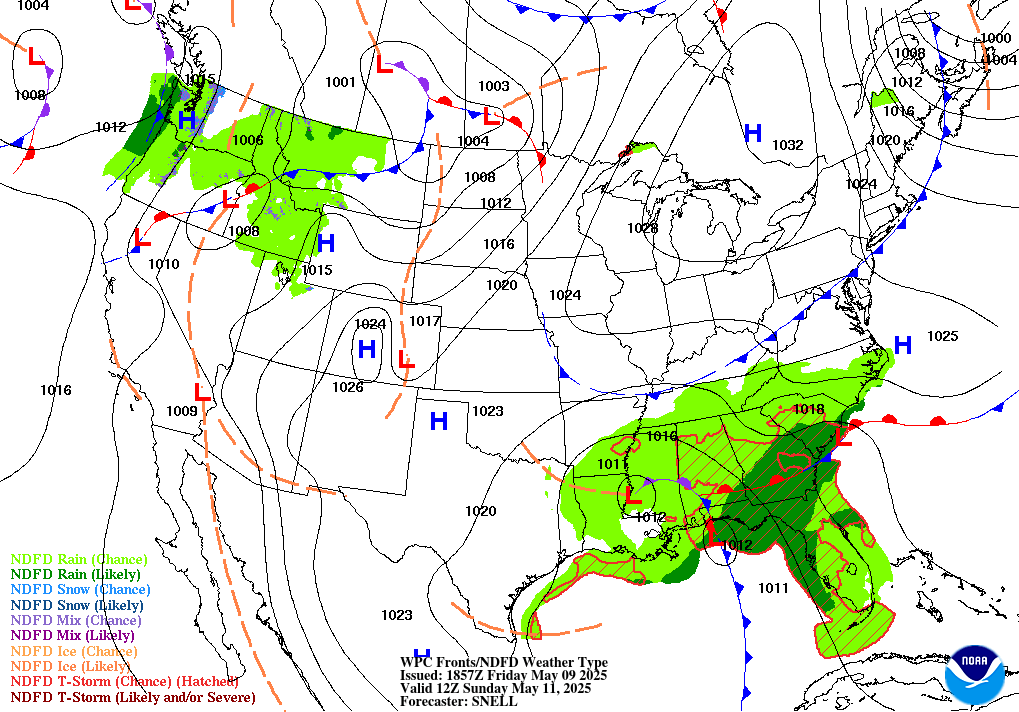
| 18-24 hr Forecast WX Map | 30-36 hr Forecast WX Map | 42-48 hr Forecast WX Map |
|
|
|
LOCAL
TEMPERATURE FORECASTS FOR NYC & LONG ISLAND THRU 72 HRS
 |
 |
 |
|
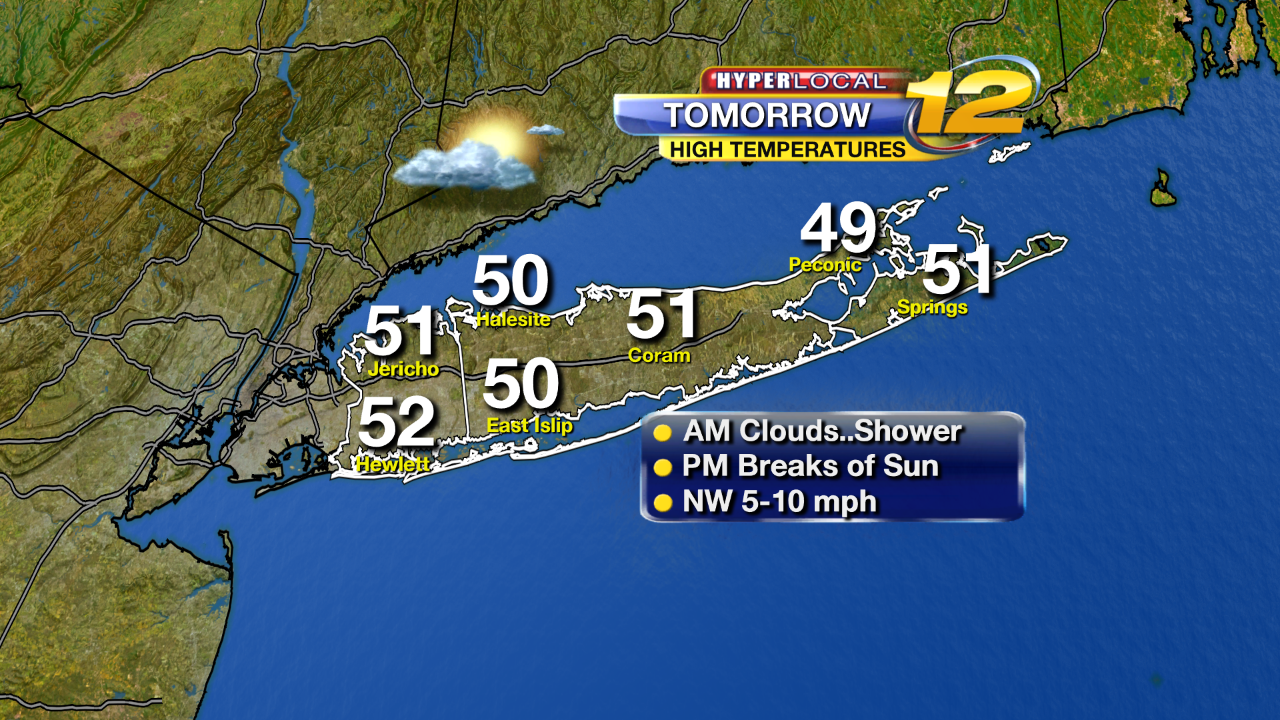
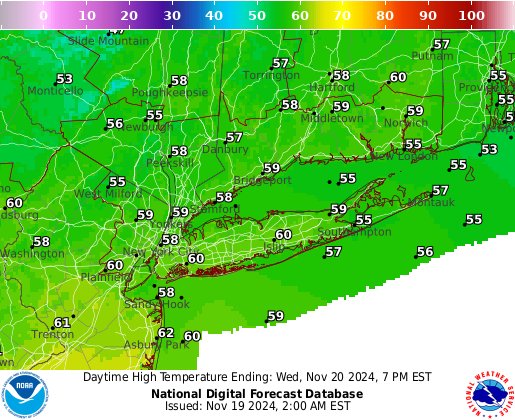
24 Hour High Temperatures
|
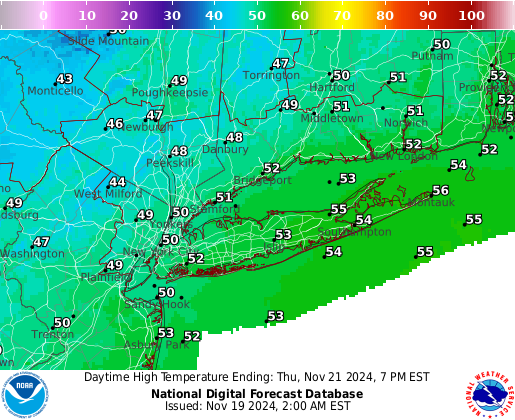
48hr High Temperatures |
72hr High Temperatures |
 |
 |
 |
|
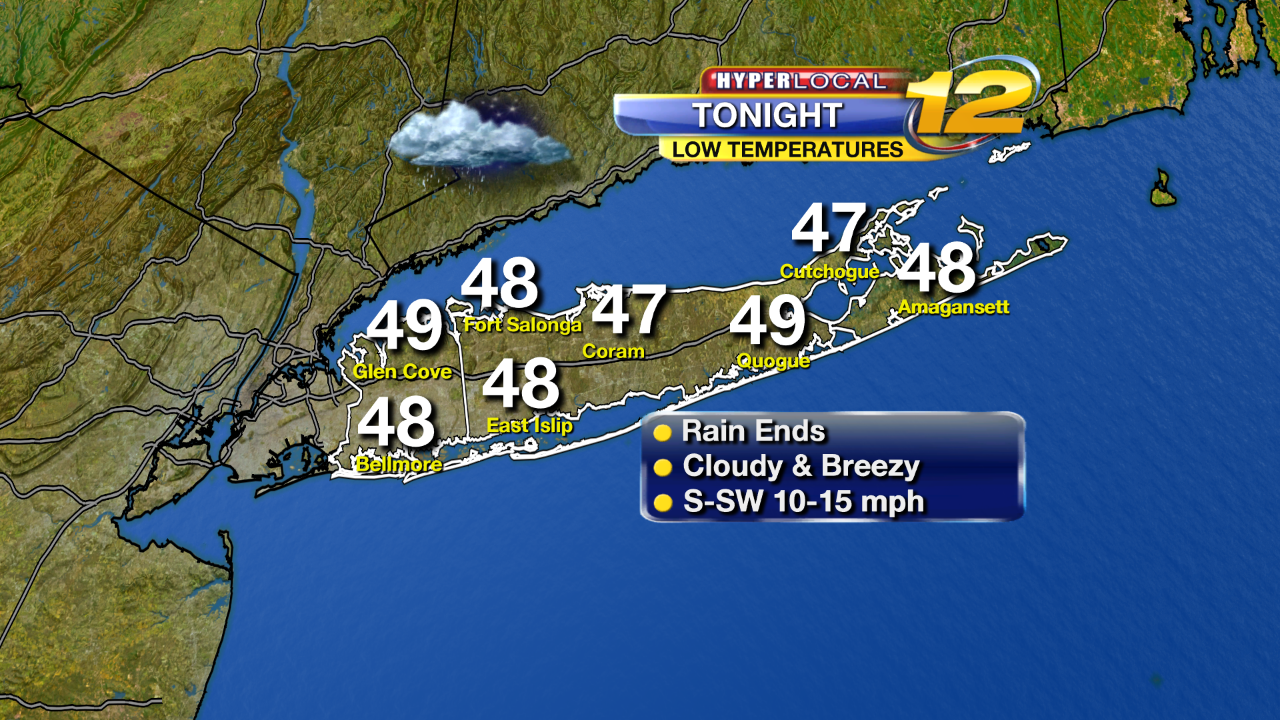
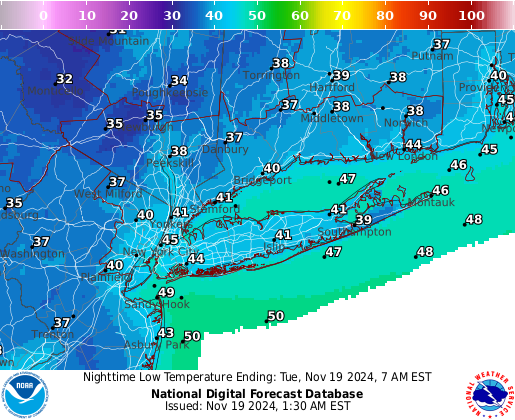
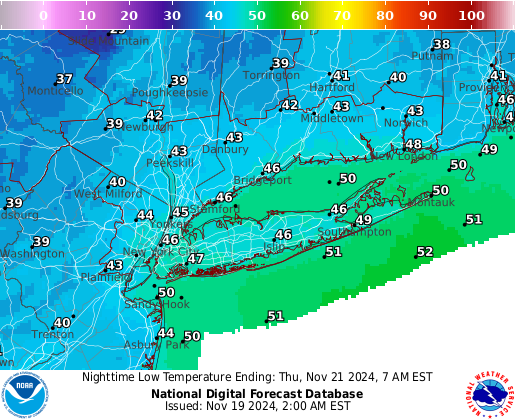
24 Hour Low Temperatures
|
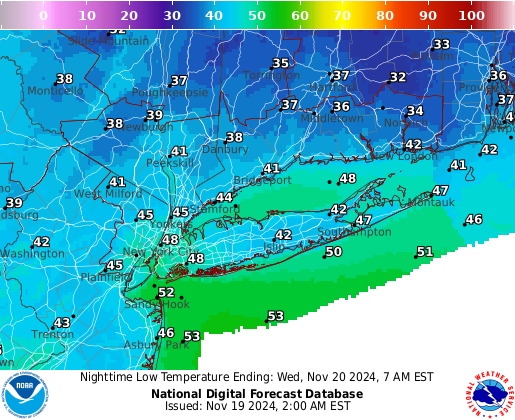
48hr Low Temperatures |
72hr Low Temperatures |
More Winter Weather Information
|
A winter weather event is a winter weather phenomenon (such as snow, sleet, ice, wind chill) that impacts public safety, transportation, and/or commerce. It typically occurs during the climatological winter season between October 15 and April 15. Outlook - Winter weather that may cause significant impact in the day 3 to 7 forecast time period and eventually lead to the issuance of a watch or warning is contained in the Hazardous Weather Outlook. More scientific discussion on the event can also be found in the Area Forecast Discussion. Forecasts in the day 3 to 7 time period typically have a lot of forecast uncertainty. Uncertainty is generally in the 30 to 50% range that the event will occur and reach warning criteria. It is intended to provide information to those who need considerable lead time to prepare for the event. Watch - A watch is generally issued in the 24 to 72 hour forecast time frame when the risk of a hazardous winter weather event has increased (50 to 80% certainty that warning thresholds will be met). It is intended to provide enough lead time so those who need to set their plans in motion can do so. A watch is issued using the WSW Winter Weather Message product and will appear as a headline in some text products such as the Zone Forecast. It will change the color, as shown in the table below, of the counties on the NWS front page map according to what type of watch has been issued.
Warning/Advisory - These products are issued when a hazardous winter weather event is occurring, is imminent, or has a very high probability of occurrence (generally greater than 80%). A warning is used for conditions posing a threat to life or property. An advisory is for less serious conditions that cause significant inconvenience and, if caution is not exercised, could lead to situations that may threaten life and/or property. Warnings and advisories are issued using the WSW Winter Weather Message product and will appear as a headline in some text products such as the Zone Forecast. It will change the color, as shown in the table below, of the counties on the NWS front page map according to what type of warning/advisory has been issued.
|
Click to enlarge  24-Hour Total QPF |
Click to enlarge  3-Day Total QPF |
Click to enlarge  3-Day Maximum Wind Gust |
Click to enlarge  2-Day Snow Accumulation |
||||||||||||||||||||||||||||
Click to enlarge  24-Hour Maximum Apparent Temperature |
Click to enlarge  24-Hour Minimum Apparent Temperature |
Click to enlarge  Min RH Day 1 |
Click to enlarge  Min RH Day 2 |
Click to enlarge  Maximum Temperautre Day 1 |
Click to enlarge  Maximum Temperature Day 2 |
Click to enlarge  Maximum Temperature Day 3 |
Click to enlarge  Minimum Temperature Day 1 |
Click to enlarge  Minimum Temperature Day 2 |
Click to enlarge  Max Temperature Change |
Click to enlarge Total Ice Accumulation |
Click to enlarge  24-Hour Observed Precip |
Click to enlarge  48-Hour Observed Precip |
Click to enlarge  Month To Date Precip |
Click to enlarge  Total Monthly Observed Precip |
Click to enlarge  Total Monthly Observed Precip Departure |
Click to enlarge  24-Hour Total QPF |
Click to enlarge  3-Day Total QPF |
Click to enlarge  3-Day Maximum Wind Gust |
Click to enlarge  2-Day Snow Accumulation |
Click to enlarge  Convective Outlook Day 1 |
Click to enlarge  Convective Outlook Day 2 |
Click to enlarge  Convective Outlook Day 3 |
||||||
Click to enlarge  24-Hour Maximum Apparent Temperature |
Click to enlarge  24-Hour Minimum Apparent Temperature |
Click to enlarge  Current Radar |
Click to enlarge  Maximum Temperautre Day 1 |
Click to enlarge  Maximum Temperature Day 2 |
Click to enlarge  Maximum Temperature Day 3 |
Click to enlarge  Minimum Temperature Day 1 |
Click to enlarge  Minimum Temperature Day 2 |
Click to enlarge  3-Day Maximum Wave Height |
Click to enlarge  24-Hour Total QPF |
Click to enlarge  Total QPF |
Click to enlarge  Maximum Wind Gust |
Click to enlarge  Total Snow Accumulation |
||||||||||||||||||||||||||||
Click to enlarge  24-Hour Maximum Apparent Temperature |
Click to enlarge  24-Hour Minimum Apparent Temperature |
Click to enlarge  Min RH Day 1 |
Click to enlarge  Min RH Day 2 |
Click to enlarge  Maximum Temperautre Day 1 |
Click to enlarge  Maximum Temperature Day 2 |
Click to enlarge  Maximum Temperature Day 3 |
Click to enlarge  Minimum Temperature Day 1 |
Click to enlarge  Minimum Temperature Day 2 |
Click to enlarge  Max Temperature Change |
Click to enlarge  Total Ice Accumulation |
Click to enlarge  24-Hour Observed Precip |
Click to enlarge  48-Hour Observed Precip |
Click to enlarge  Month To Date Precip |
Click to enlarge  Total Monthly Observed Precip |
Click to enlarge  Total Monthly Observed Precip Departure |
Click to enlarge 24-Hour Total QPF |
Click to enlarge Total QPF |
Click to enlarge Maximum Wind Gust |
Click to enlarge Total Snow Accumulation |
Click to enlarge Convective Outlook Day 1 |
Click to enlarge Convective Outlook Day 2 |
Click to enlarge Convective Outlook Day 3 |
||||||
Click to enlarge 24-Hour Maximum Apparent Temperature |
Click to enlarge 24-Hour Minimum Apparent Temperature |
Click to enlarge Current Radar |
Click to enlarge Maximum Temperautre Day 1 |
Click to enlarge Maximum Temperature Day 2 |
Click to enlarge Maximum Temperature Day 3 |
Click to enlarge Minimum Temperature Day 1 |
Click to enlarge Minimum Temperature Day 2 |
Click to enlarge 3-Day Maximum Wave Height |